Hi All,Just sharing my continued adventures with Qt on NetBSD. This time debugging a non-Qt c++ project -Qt projects I have not yet tested. The good news is: it works :)
However, there are some minor things one has to do:

LLDB (doesn't really work, see description):
-export LD_LIBRARY_PATH=/usr/pkg/lib otherwise Qt Creator does not find some shared libs
-start Qt Creator and it will find the debugger if it's installed, you just have to select it for your kit
-load a non-Qt c++ project, set a breakpoint and start the debugger in the debug menu like: Debug->Start Debugging->Start and Debug External Application
-you'll get a popup with some options where you must decide how you want to start the debugger then hit ok
-lldb will launch but if you set a breakpoint in a shared library it does not find its source so it jumps in the assembly and similarly it can't step in a function which is part of a shared library
-otherwise it seems to work but due to the shared library limitation I stopped experimenting wiht it and it may even be a QT Creator bug as well since I found related bug reports from other platforms as well
GDB:-upgrade gdb from 8.3 that comes with the system to 10.1 as the one shipped with the system does not support python scripting or what -I guess it was just not compiled like that. So Qt Creator will complain about that.
-make sure that gdb 10.1 is found first in your PATH-I also do export LD_LIBRARY_PATH=/usr/pkg/lib since it was necessary for lldb but I haven't checked without it when using gdb
-Start Qt Creator and it will find the debugger if it's installed, you just have to select it for your kit
-gdb has a dedicated menü in Qt Creator Options unlike lldb so there's a ton of settings for it. If you have .gdbinit in your home it may be a good idea to check the option to ignore loading it.
-load a non-Qt c++ project, set a breakpoint and start the debugger in the debug menu like: Debug->Start Debugging->Start and Debug External Application
-you'll get a popup with some options where you must decide how you want to start the debugger then hit ok
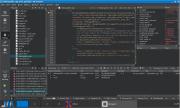
-Enjoy :) Everything I needed so far worked e.g. debugging shared library code, checking variable values, stack, analysing core dumps.
Best regards,

r0ller
Attachment:
qtcreator_gdb.jpg
Description: JPEG image